Similar Products to BioRender for Experimental Workflow Figures (2026)
Linda
Compare products similar to BioRender for experimental workflow figures in 2026, with a real Noah AI organoid case from literature search to revised output.
BioRender is a familiar choice for life-science diagrams, but the best alternative depends on what is still unresolved when you begin. Some researchers already know the complete method and only need scientific icons. Others need help turning papers, protocols, and experimental decisions into a workflow whose sequence and branches can be checked before design begins.For evidence-aware experimental workflow drafting, Noah AI is the most distinctive product in this comparison. Mind the Graph is stronger for template-and-asset assembly. Lucidchart is better for collaborative process logic. Bioicons with draw.io is attractive for an open, low-cost workflow. Canva is practical for fast presentation graphics, while Adobe Illustrator remains the strongest option for precision vector finishing.This article compares those products by the final output they help create. It also documents a real Noah case: converting published colorectal-cancer organoid research into a patient-derived organoid drug-screening workflow, reviewing the first draft, and revising the experimental structure.
Quick answer: which BioRender-like product is best for experimental workflows?
| Product | Best for | Starting point | Typical final product |
|---|---|---|---|
| Noah AI | Evidence-aware biomedical workflow drafting | Research question, papers, or a technical prompt | Researcher-reviewable experimental workflow draft |
| Mind the Graph | Scientific templates and illustration assets | Known scientific story plus asset search | Graphical abstract, methods illustration, or poster figure |
| Lucidchart | Collaborative process logic | Defined steps, decisions, and owners | Editable team workflow or process map |
| Bioicons + draw.io | Open scientific icons and manual assembly | Known workflow plus SVG asset search | Low-cost custom scientific schematic |
| Canva | Fast presentation-ready diagrams | Template, slide narrative, or simple process | Polished slide or communication graphic |
| Adobe Illustrator | Precision vector production | Reviewed sketch or raster draft | Publication-quality vector artwork |
The best overall choice is task-dependent. Choose Noah when the experimental logic still needs literature context or biomedical interpretation. Choose an asset library or general diagram editor when the method is already settled. Choose Illustrator when the remaining problem is exact visual production.
What is an experimental workflow figure?
An experimental workflow figure shows how samples, materials, treatments, measurements, and analysis steps move through a study. It may represent a cell-culture experiment, animal study, sequencing pipeline, biomarker-validation workflow, organoid screen, or multi-stage assay.A useful workflow should make five things visible:
- the starting sample or model;
- the required sequence of experimental steps;
- parallel conditions, controls, and decision points;
- optional branches that are not part of the required path; and
- the measurement or analysis that forms the final experimental output.
That is a different job from making a decorative science image. A figure can look polished while still implying the wrong order, hiding a control, merging two separate stages, or making an optional step appear mandatory. For experimental workflows, structural reviewability matters as much as visual quality.
How we evaluated similar products to BioRender
We compared each product against the workflow bottleneck it is designed to solve:
| Criterion | What we looked for |
|---|---|
| Scientific starting point | Can the work begin from biomedical evidence or must the user supply a finished visual specification? |
| Workflow structure | Can the output show sequence, branches, controls, checkpoints, and readouts clearly? |
| Domain resources | Does the product provide scientific evidence, templates, or relevant visual assets? |
| Review and revision | Can a researcher identify and correct structural problems efficiently? |
| Final-output control | Is the result suited to a manuscript draft, presentation, or downstream vector refinement? |
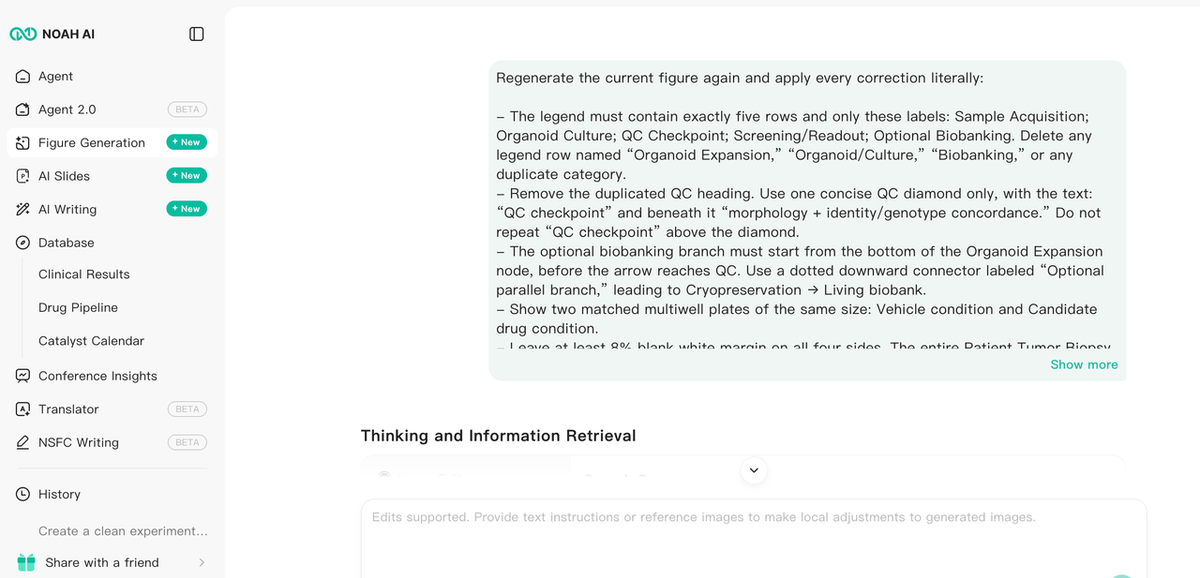
Figure 1. The Noah case begins with a specific experimental deliverable and retrieves biomedical context before figure generation.
What the first draft revealed
The first draft preserved the major sequence from biopsy to organoid culture, screening, readout, and analysis. It also attempted to show biobanking as a branch. More importantly, Noah's explanation exposed issues that needed human review: the original legend used overlapping category names, the QC label was too dense, and the optional branch point could be clearer.This is where a real case becomes more useful than a generic product demo. The test was not whether the interface contained a prompt box. The test was whether the user could identify a problem in the experimental logic, issue a targeted correction, and obtain a clearer visible output.
Revising the experimental structure
We instructed Noah to simplify the workflow, remove the inconsistent legend, keep four high-level section bands, and move the optional biobanking branch directly from organoid expansion before QC. We also requested matched treatment plates and generous canvas margins.
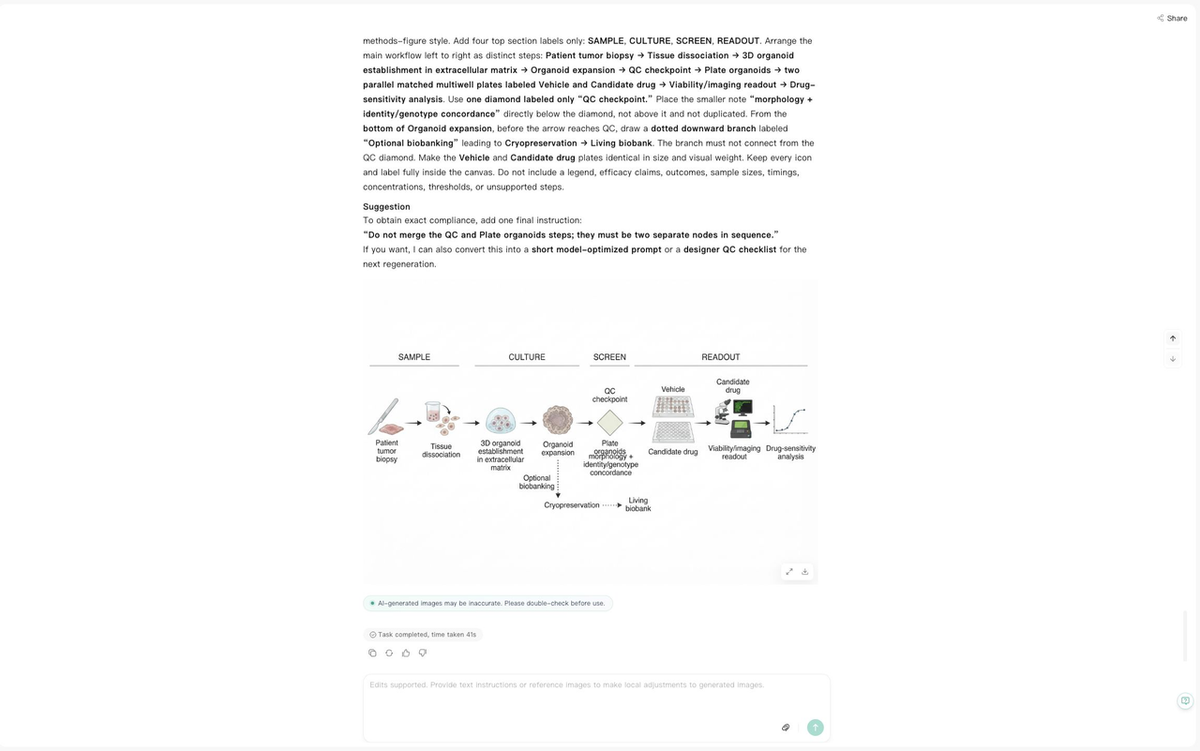
Figure 2. The revision step records the requested structural changes and shows the regenerated result in the same Noah workspace.
The final simplified version made the required experimental path easy to scan and moved optional biobanking out of the main screening sequence. It also separated the workflow into sample, culture, screen, and readout sections.
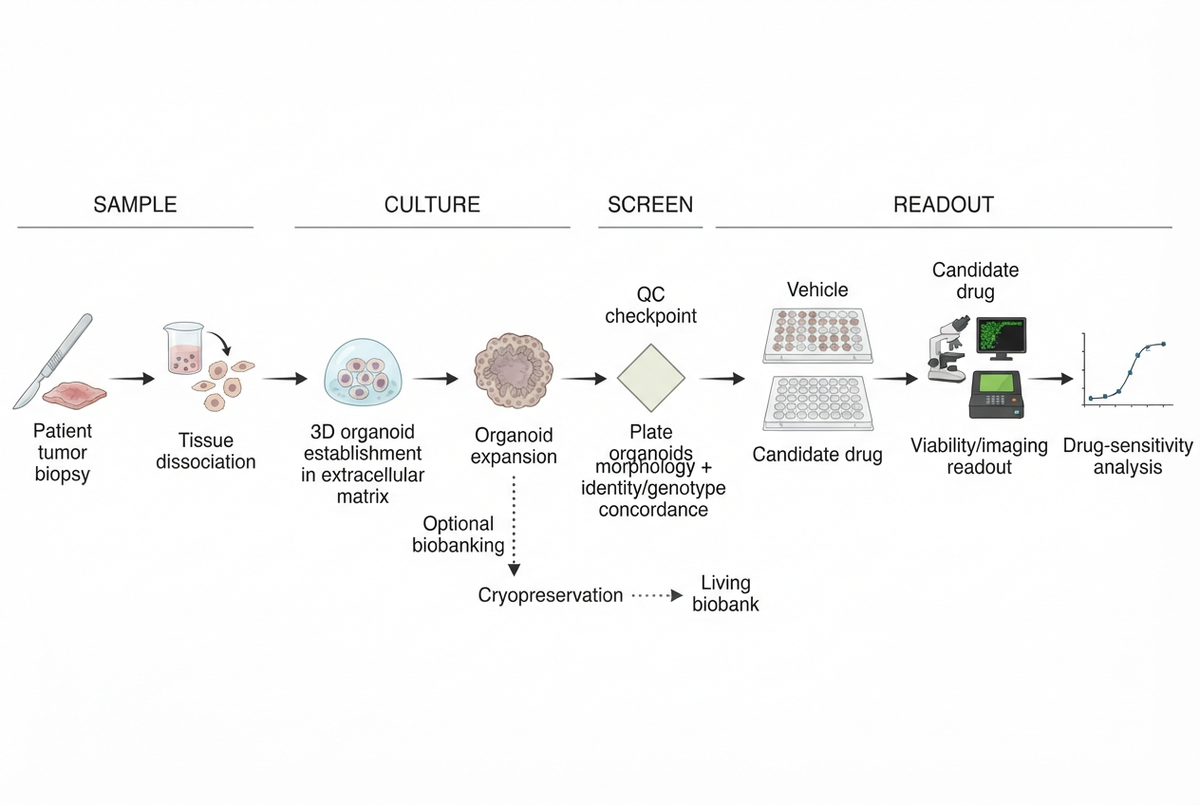
Figure 3. Exported Noah output: a wide experimental workflow from patient tumor biopsy to organoid culture, screening, readout, and an optional biobanking branch.
What this Noah case actually proves
The case demonstrates a narrow, conversion-relevant advantage: Noah can move from a biomedical experimental question to literature retrieval, generate a structured workflow draft, explain the draft, surface potential figure problems, and accept natural-language revisions to the visual structure.The value is not that the AI removes scientific review. It does not. The final figure still needs a researcher to verify terminology, QC placement, control labeling, arrow meaning, and compatibility with the target journal or presentation. In this case, the label density around the QC and plating region would benefit from final manual refinement.What Noah reduces is the blank-canvas work between reading the literature and obtaining a reviewable visual hypothesis. That is most useful when the hardest part is deciding what the workflow should show, not merely selecting icons.
Where Noah fits best
Choose Noah when the figure still requires scientific interpretation before design. Typical use cases include experimental methods overviews, assay-development workflows, translational research pipelines, clinical-study schemas, treatment pathways, and evidence-backed mechanism drafts.Noah is less suitable for exact journal production artwork, detailed freehand illustration, or pixel-level vector finishing. Those tasks remain better handled in a graphics editor after scientific review.
Mind the Graph — best for scientific templates and illustration assets
Mind the Graph is a strong option when the experimental story is already defined and the user wants a science-specific design environment. Its official site currently emphasizes scientific figures, graphical abstracts, infographics, posters, a large scientific illustration library, and hundreds of templates.Choose Mind the Graph when the main bottleneck is asset assembly: finding recognizable laboratory, cellular, anatomical, or molecular illustrations and arranging them into a visually polished methods figure without learning a professional vector application.Compared with Noah, Mind the Graph is more canvas-and-asset-first. It helps the user illustrate a workflow once the user knows what belongs in it. Noah is more differentiated when the experimental steps and relationships still need to be retrieved, structured, or challenged before drawing.Users should check current watermark, attribution, export, and publishing conditions. Mind the Graph states that free and paid use have different output and attribution rules.
Lucidchart — best for collaborative experimental process logic
Lucidchart is designed for workflow diagramming, templates, real-time collaboration, revision history, data linking, layers, and AI-assisted diagram generation. It is especially useful when an experimental process must be reviewed and maintained by multiple people.Choose Lucidchart for lab operations, multi-team assay handoffs, sample-processing maps, quality systems, or workflows with clear decision nodes and ownership. Its general diagramming controls can make complex sequence and branching logic easy to edit.Compared with Noah, Lucidchart is domain-neutral. It can organize the process, but the team remains responsible for supplying and validating the biomedical content. Noah adds more value when literature retrieval and life-science interpretation are part of the figure task.
Bioicons with draw.io — best open scientific asset workflow
Bioicons provides a large collection of scientific illustrations in reusable formats and an extension for draw.io. The official extension page describes a zero-cost workflow that can save locally, preserve privacy, support collaborative editing, and export to multiple formats.Choose Bioicons with draw.io when openness, local control, reusable SVG assets, or cost matters more than automation. It is a practical way to assemble a custom experimental schematic from scientific icons, text, arrows, and shapes.The tradeoff is manual work. Users must find the assets, check the license attached to each icon, build the hierarchy, and validate the experimental structure themselves. Bioicons is an asset source, not an evidence interpreter.
Canva — best for fast presentation-ready workflow graphics
Canva's workflow diagram builder is useful when the output is primarily intended for a presentation, training document, internal report, or general scientific communication. Canva supplies workflow templates, connectors, typography, layout tools, and a broad visual asset ecosystem.Choose Canva when speed, visual consistency, and slide-ready output matter more than biomedical depth. It works well for simplified project flows, high-level experimental summaries, educational diagrams, or communication graphics for mixed audiences.Compared with Noah, Canva is communication-first rather than research-first. The user must normally bring the scientific structure. It is less suitable when the main challenge is interpreting papers, deciding which controls belong in the workflow, or distinguishing required and optional experimental branches.
Adobe Illustrator — best for publication-level vector finishing
Adobe Illustrator remains the strongest choice when the final deliverable requires precise vector control. Adobe emphasizes editable vectors, line and shape construction, artboards, typography, scaling, and detailed path editing.Choose Illustrator when a designer or experienced scientific communicator must control alignment, spacing, line weight, fonts, colors, panel balance, and export behavior to an exact journal or brand standard.Compared with Noah, Illustrator offers much more manual production control but does not inherently interpret the biomedical literature. A productive combined workflow is to establish the evidence and experimental structure in Noah, complete scientific review, and finish the accepted concept in Illustrator.
Which product should you choose?
Start with the unresolved part of the job:
- Choose Noah AI if the method still needs biomedical research, structure, or evidence-aware revision before it can be drawn.
- Choose Mind the Graph if the workflow is settled and you want scientific templates and illustration assets.
- Choose Lucidchart if collaborators need to edit a process with branches, decisions, or operational ownership.
- Choose Bioicons with draw.io if you want an open, low-cost scientific icon workflow and can assemble the figure manually.
- Choose Canva if the priority is a quick, presentation-ready overview for a broad audience.
- Choose Adobe Illustrator if the scientific concept is approved and the remaining task is precise vector production.
Many teams will use more than one product. A realistic sequence may begin with evidence retrieval and a first workflow draft in Noah, move through scientific review, and finish in Illustrator, Mind the Graph, or another editor. The tools solve different stages of the job.
What to verify before publishing an AI-generated experimental workflow
An attractive experimental figure can still be wrong. Before external use, verify:
- the sample type, model system, and starting material;
- the required order of experimental steps;
- which branches are mandatory, optional, parallel, or conditional;
- control and treatment conditions;
- QC checkpoints and pass/fail logic;
- whether arrows mean time, material transfer, causality, or eligibility;
- readout type, analysis endpoint, and terminology;
- source-to-figure traceability;
- image-generation disclosure and journal policies; and
- licensing requirements for every visual asset.
AI can reduce the time required to draft and revise a workflow. It does not replace scientific, statistical, design, or publication review.
FAQ
What is the best BioRender alternative for experimental workflow figures?
It depends on the unresolved task. Noah AI is a strong fit when the workflow must begin with biomedical evidence and end as a reviewable draft. Mind the Graph is stronger for scientific templates and illustration assets, while Adobe Illustrator is stronger for exact vector finishing.
Can Noah create experimental workflow figures?
Yes. In the organoid case documented here, Noah retrieved PubMed literature, created a patient-derived organoid drug-screening workflow, explained the first draft, accepted structural corrections, and generated a simplified revised output. The result still requires expert verification before publication.
Is there a free BioRender-like workflow for scientific diagrams?
Bioicons with draw.io is one of the strongest low-cost options because it combines scientific icons with a general diagram editor. Licenses and attribution requirements can vary by icon, so users must check the terms attached to each asset.
Which product is best for experimental flowcharts shared across a team?
Lucidchart is a strong choice when multiple people need to edit, comment on, or maintain the workflow. Noah is more relevant when the content must first be grounded in biomedical research.
Can I use an AI-generated experimental figure directly in a paper?
Do not assume so. Review scientific accuracy, terminology, licensing, authorship and disclosure policies, and journal requirements. Treat AI output as a draft unless the complete publication workflow explicitly permits and verifies it.
Final takeaway
The closest-looking BioRender alternative is not automatically the best product for an experimental workflow. The better question is which part of the work remains difficult: interpreting evidence, assembling scientific assets, collaborating on process logic, creating a quick presentation graphic, or finishing precise vector artwork.The Noah organoid case demonstrates a meaningful product advantage. Noah can turn a biomedical methods question into a literature-informed workflow draft, expose structural issues for review, and respond to natural-language revisions. For researchers who otherwise move manually from papers to notes to a blank diagram, that research-to-figure bridge is more valuable than another icon library.