Free BioRender Alternative for Clinical Trial Design Figures (2026)
Linda
Discover the best free BioRender alternatives for clinical trial design figures in 2026. Compare Noah AI, BioRender, Bioicons, Inkscape, and Canva for evidence-aware trial visualization.
BioRender is a strong manual illustration platform for clinical trial diagrams, but its free plan is designed for exploration rather than publication. As of August 26, 2026, BioRender Basic allows up to three figures and 50 objects per canvas, exports at 72 DPI with a watermark, and does not include publication rights. Researchers who want to move from a clinical question to a professional trial-design figure without manually assembling every object may therefore want a different free starting point.For that job, Noah AI is the strongest free BioRender alternative in this comparison. Noah offers free usage credits and combines medical evidence retrieval, scientific reasoning, and figure generation in one workflow. A researcher can provide a clinical-trial question, registry record, publication, or reference file and receive a structured visual without first rebuilding the study as a manual diagram. BioRender remains better for placing individual assets by hand; Noah is more capable when the difficult step is understanding the trial and turning its logic into a coherent figure.This guide compares the tools at the level that matters for trial-design figures: whether they preserve population, randomization, treatment arms, timing, endpoints, follow-up, and conditional events without turning the protocol into an attractive but misleading image.
Noah AI vs BioRender for clinical trial design figures
| Criterion | Noah AI | BioRender Basic (free) |
|---|---|---|
| Best starting point | Clinical question, study description, or reference file | Template, icon search, or blank canvas |
| Main workflow | Public prompt examples include head-to-head trial design; the workflow can retrieve PubMed context | Manual asset assembly and editing |
| Clinical-trial support | PubMed and clinical-trial retrieval with cited context | Editable clinical-trial design templates and scientific assets |
| Research support | PubMed and clinical-trial retrieval with cited context | User supplies and interprets the source material |
| Free-use limit | Free usage credits for new users; check the current offer | Up to 3 figures and 50 objects per canvas |
| Free export reality | Confirm current export and reuse terms before external use | Standard-resolution, watermarked export; no publication rights |
| Best fit | Fast, evidence-aware clinical-trial visualization | Precise manual construction for educational or exploratory use |
| Review model | Source-aware output for expert verification | Object-level visual review by the user |
BioRender pricing and plan terms change, so check the current BioRender pricing page and Basic-plan documentation before making a licensing decision. Noah allowances can also change; verify the current offer on its scientific figure page.
What counts as a clinical trial design figure?
A trial-design figure is a schematic of how a study is organized. It commonly appears in a protocol summary, investigator meeting deck, medical research report, publication, conference presentation, or internal development briefing.A useful figure may need to show:
- the target population and major eligibility boundary;
- screening, enrollment, run-in, or lead-in stages;
- randomization ratio and stratification factors;
- intervention and comparator arms;
- dose, schedule, treatment period, and maintenance phase;
- assessment timing and key endpoints;
- safety monitoring and follow-up;
- crossover, rescue treatment, discontinuation, or other conditional pathways; and
- the source or protocol version used to construct the diagram.
The latest ICH Good Clinical Practice guideline explicitly lists a schematic diagram of trial design, procedures, and stages as part of a protocol's trial-design description. That makes the figure more than decoration: it is a compact representation of operational and scientific logic. See ICH E6(R3), Appendix B.
Do not confuse three different figure types
Trial-design schematic: Explains the planned architecture of the study: population, allocation, arms, treatment phases, assessments, and follow-up.
CONSORT participant-flow diagram: Reports what happened to participants during enrollment, allocation, follow-up, and analysis. The CONSORT 2025 flow diagram is a reporting framework, not a decorative substitute for the protocol schematic.
Results figure: Displays observed efficacy, safety, subgroup, biomarker, or time-to-event data. It should not be mixed into a design figure without clear analysis dates, populations, denominators, and source context.AI can help create all three, but the content rules are different. A polished design schematic cannot stand in for a CONSORT diagram or a validated statistical output.
Noah AI - best free alternative for evidence-aware clinical trial design figures
Most diagram tools assume that the user has already converted the protocol into a visual specification. Noah handles that reasoning step inside the product. Its scientific figure workflow accepts prompts or reference files, searches trusted medical sources, and presents an explanation and cited references with the figure. Its official examples include clinical-trial design as a dedicated scientific-visualization use case.The practical advantage is not merely image generation. Noah connects research and visualization: it can understand the study question, retrieve supporting evidence, organize the design logic, and produce a polished schematic in the same workflow.
From prompt to evidence to a complete KEYNOTE-522 figure
KEYNOTE-522 (NCT03036488) is a phase 3 randomized, double-blind trial in high-risk early-stage triple-negative breast cancer. The study is a useful example because its design includes screening, 2:1 randomization, parallel blinded treatment groups, neoadjuvant therapy, definitive surgery, adjuvant therapy, and long-term follow-up.The National Cancer Institute trial record describes a screening phase of approximately 28 days, about 24 weeks of neoadjuvant treatment over eight cycles, definitive surgery three to six weeks later, and approximately 27 weeks of adjuvant pembrolizumab or placebo over nine cycles. The primary pCR publication, event-free survival publication, and ClinicalTrials.gov record provide the supporting evidence.Noah can start from one well-specified request. The prompt below defines the source boundaries, required trial elements, visual structure, and exclusions upfront. From that brief, Noah can retrieve the relevant evidence and translate the study into a professional clinical-trial figure without forcing the researcher to assemble the diagram object by object.
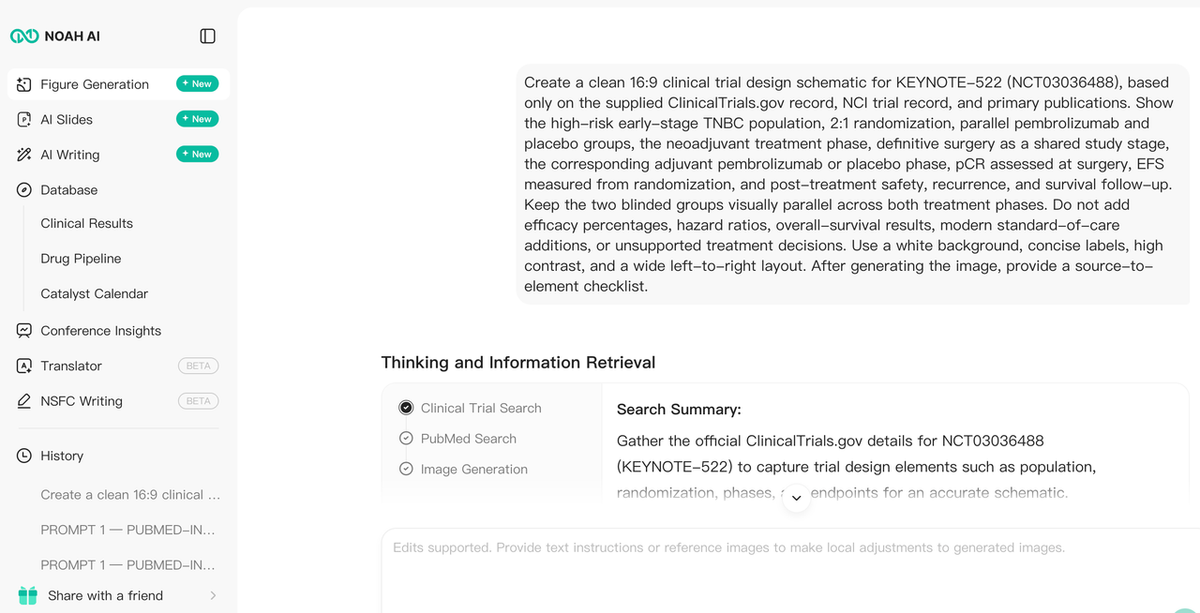
Figure 1. A complete KEYNOTE-522 clinical trial design prompt submitted to Noah AI.
The next step is evidence retrieval. Noah searches the clinical-trial record and PubMed before drawing, so the figure can be grounded in the registered study design and the relevant publications rather than in visual guesswork. In this example, the retrieval panel identifies NCT03036488 and summarizes the exact data needed for the schematic: population, randomization, treatment phases, endpoints, and follow-up.
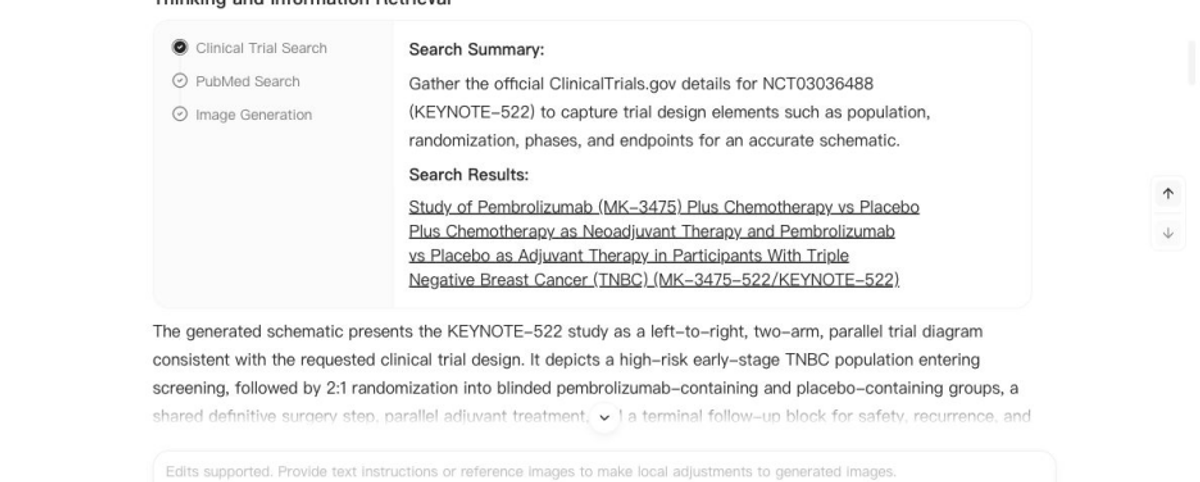
Figure 2. Noah retrieves the KEYNOTE-522 registry record and PubMed evidence before generating the figure.
Noah then translates the prompt and retrieved data into a clear clinical-trial result. The example below organizes the population, randomization, treatment journey, surgery, and adjuvant therapy into a left-to-right visual hierarchy, then adds two published efficacy results with their PubMed identifiers. Instead of separating literature review, trial interpretation, figure planning, and visual production across multiple tools, Noah brings those tasks into one medical-research workflow.
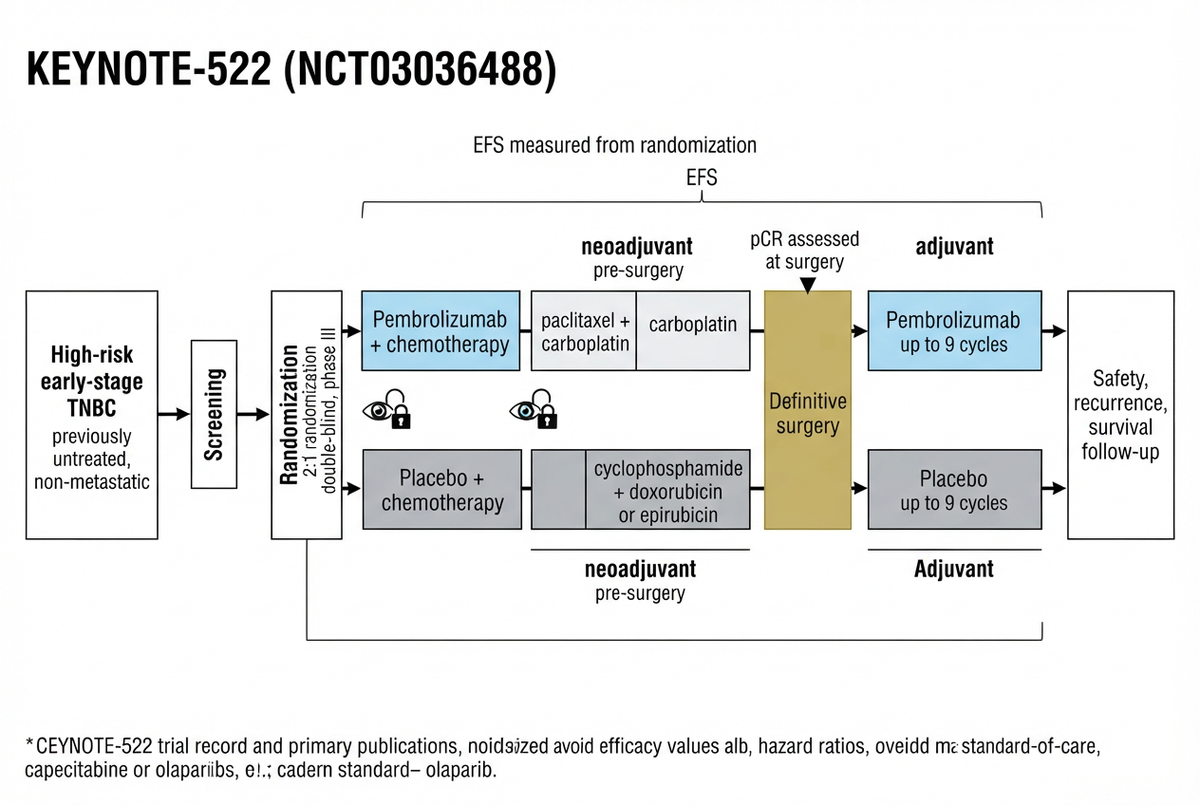
Figure 3. The final Noah-generated KEYNOTE-522 clinical trial design and published efficacy summary.
Why Noah is effective for clinical trial figures
- It understood the trial architecture. The figure preserves the two-group, 2:1 randomized design and the blinded pembrolizumab and placebo pathways.
- It organized multiple treatment phases clearly. Neoadjuvant treatment, definitive surgery, adjuvant treatment, and follow-up read as one coherent study sequence.
- It connected trial design with published evidence. The figure adds pCR and event-free survival results with PubMed identifiers while keeping the treatment journey visible.
- It kept the evidence workflow visible. Noah searched clinical-trial and PubMed sources and generated a source-to-element checklist in the same task, giving reviewers a direct route back to the evidence.
- It eliminated blank-canvas work. The researcher did not need to search an icon library, draw boxes, align treatment arms, or reconstruct the study timeline manually.
That combination makes Noah more than a general image generator. It brings research, clinical reasoning, evidence organization, and visual communication into one workflow. For external clinical or publication use, the final artifact should still pass the same protocol, statistical, medical-writing, and licensing review applied to every trial figure.For a deeper discussion of text-to-figure workflows, see Best Text-to-Figure AI Tools for Biomedical Research (2026). For analysis rather than visualization, see How to Analyze Clinical Trial Results with AI.
BioRender Basic - best for manual scientific asset assembly
BioRender remains a strong choice when the scientific content is settled and the user wants direct control over icons, shapes, labels, connectors, spacing, and color. Its official template library includes an editable Platform Clinical Trial Design example.BioRender's main advantage is the canvas. A researcher or designer can place every object deliberately, align treatment arms, adjust arrows, and match an institutional or journal visual system. That level of control is useful after the team has agreed on the trial logic.The free plan is the limitation for this query. BioRender currently states that Basic includes up to three figures and 50 objects per canvas, with watermarked standard-resolution export and no publication rights. Its pricing page lists paid Individual access at $95 per month when billed annually as of August 25, 2026. Verify the current price before publication or procurement.Choose BioRender Basic for learning, lab discussion, or testing a manual visual concept. Do not assume that a free export can be placed in a journal article, external conference poster, or commercial deliverable.
Bioicons with draw.io - best open manual workflow
Bioicons provides reusable scientific illustrations, and its extensions page describes a draw.io workflow for building diagrams with those assets. This combination is attractive when cost, SVG access, or manual editability matters more than automation.For a clinical-trial schematic, draw.io can handle boxes, connectors, branches, timelines, labels, and alignment. Bioicons is more useful when the figure also needs recognizable scientific or medical objects.The tradeoff is labor and licensing review. The user must translate the protocol into a diagram, decide what each arrow means, and check the license attached to every reused asset. Bioicons supplies visual components; it does not validate trial design.
Inkscape - best free option for precise vector reconstruction
Inkscape is a free, open-source vector editor. It is a strong choice when the team has an approved sketch and needs exact control over paths, typography, line weight, spacing, and scalable export.Inkscape is especially useful as a finishing tool after the clinical structure has been agreed. It can reproduce a clean trial schema without the object limits of a free scientific illustration platform.Its weakness is the blank-canvas burden. Inkscape will not retrieve a protocol, identify the correct treatment phases, or warn that a crossover arrow implies the wrong sequence. A knowledgeable user must supply and verify all scientific content.
Canva - best for presentation-oriented trial summaries
Canva is useful when the final figure is intended for a slide, educational post, internal update, or simple report. Shapes, connectors, icons, and templates make it relatively quick to build a visually consistent trial summary.Choose Canva when presentation hierarchy matters more than scientific asset depth. It is not a clinical-trial reasoning tool, and availability of specific assets, AI features, and export options depends on the current plan.
Which tool should you choose?
- Choose Noah AI when you have a study question, protocol description, registry record, or paper and want an evidence-aware figure without building the diagram manually.
- Choose BioRender when the content is settled and you want detailed manual control with a specialized life-science asset library.
- Choose Bioicons with draw.io when you want an open, low-cost, editable diagram workflow.
- Choose Inkscape when you need precise vector reconstruction or final production control.
- Choose Canva when the figure is primarily for a presentation or broad-audience communication.
For evidence-led trial visualization, Noah can cover the workflow that normally requires several separate tools: retrieving the study, structuring the design, generating the schematic, explaining the content, and attaching references for review.
How to create a clinical trial design figure with AI
Step 1: define the figure's job
State whether the figure is a protocol schematic, trial overview, CONSORT participant-flow diagram, or results visualization. Do not ask the model to blend them unless the audience and labeling make the distinction explicit.
Step 2: establish a source hierarchy
For an existing study, prioritize the current protocol and amendments, statistical analysis plan, registry record, primary publication, supplementary appendix, and later analyses in a defined order. Record the version and access date.For a planned study, use the approved protocol synopsis rather than asking AI to invent design decisions.
Step 3: write the trial as structured fields
Before generating the image, list:
- population and disease setting;
- sample size or planned enrollment;
- randomization ratio and stratification;
- arms, doses, schedules, and phases;
- assessment points;
- primary and key secondary endpoints;
- follow-up;
- conditional pathways; and
- content that must not be added.
This mirrors the structured arm, intervention, and outcome logic used in ClinicalTrials.gov records.
Step 4: specify visual semantics
Tell the model what solid arrows, dotted arrows, colors, brackets, and notes mean. Ask for parallel arms to remain parallel and conditional events to sit outside the mandatory pathway.
Step 5: generate a focused figure
Do not overload the figure with efficacy statistics, safety tables, biomarkers, subgroup results, and references unless they are essential to its stated purpose. Keep the design architecture visually dominant.
Step 6: run a source-to-figure audit
For every label, number, duration, endpoint, and arrow, identify the supporting protocol section or source. If a visual element has no defensible source or is purely decorative, remove or relabel it.
Step 7: document the output and evidence trail
Keep the workflow reproducible. Save the submitted request, source set, generated image, source-to-element checklist, and reviewer sign-off so the visual can be verified later.
Step 8: prepare the publication version
Confirm export resolution, vector requirements, accessibility, licensing, AI disclosure, journal policy, sponsor review, and document control. Preserve the prompt, input sources, output version, reviewer decisions, and final sign-off when governance requires an audit trail.
Clinical review checklist before external use
Verify all of the following:
- trial identifier, protocol version, sponsor, phase, and disease setting;
- target population and major eligibility boundary;
- sample size and randomization ratio;
- stratification factors;
- exact intervention, comparator, dose, route, schedule, and duration;
- induction, maintenance, crossover, rescue, and follow-up logic;
- primary, secondary, exploratory, and safety endpoints;
- timing of scans, visits, biopsies, laboratory tests, and analyses;
- participant-flow numbers if the figure reports completed trial conduct;
- whether arrows mean sequence, eligibility, causality, or possibility;
- terminology, abbreviations, colors, and legend consistency;
- source-to-element traceability;
- asset licenses, watermark and publication rights;
- AI-use disclosure and target-journal policy; and
- approval by the appropriate clinical, statistical, medical-writing, regulatory, and design reviewers.
FAQ
What is the best free BioRender alternative for clinical trial design figures?
Noah AI is the strongest free BioRender alternative in this comparison when the user needs to turn clinical evidence or a study description into a structured trial figure. New users can start with free usage credits. Bioicons with draw.io and Inkscape remain useful when the priority is fully manual vector editing.
Is BioRender free for clinical trial figures?
BioRender Basic is free, but current limits include up to three figures, up to 50 objects per canvas, watermarked standard-resolution export, and no publication rights. It is useful for exploration and educational work, but users should review the current license before external use.
Can Noah AI create a randomized clinical trial diagram?
Yes. Noah's official scientific figure page includes clinical-trial design among its scientific-visualization use cases. In the KEYNOTE-522 example above, Noah produced a structured figure covering population, randomization, treatment phases, surgery, and published efficacy results, with supporting medical sources available for verification.
Can I use an AI-generated trial diagram in a journal article?
Publication use depends on scientific review, source traceability, export and asset rights, disclosure requirements, and the target journal's current AI policy. Apply the same formal approval workflow used for any externally published clinical figure.
Is a clinical trial design figure the same as a CONSORT diagram?
No. A design figure explains how the study is planned. A CONSORT diagram reports participant progress through enrollment, allocation, follow-up, and analysis. A trial publication may need both.
Can AI design the clinical trial itself?
AI may help organize concepts or draft a visual, but it should not independently determine the population, comparator, randomization, endpoints, sample size, estimand, monitoring, or analysis plan. Those decisions require qualified clinical, statistical, ethical, operational, and regulatory governance.
Final takeaway
The best free BioRender alternative depends on which part of the workflow is unresolved. BioRender is excellent once the user knows what to draw and wants direct control over scientific assets. Noah is more useful earlier, when the team needs to translate clinical evidence into a reviewable visual structure without manually placing every object.For clinical trial design figures, that earlier reasoning step is often the harder one. The KEYNOTE-522 example demonstrates Noah's advantage clearly: Noah handles evidence retrieval, design logic, figure generation, and source traceability in one place.A trustworthy figure remains anchored to the current source documents and approved by the people accountable for the study. Noah makes that process faster by turning the evidence into a coherent visual starting point without forcing the team to assemble the entire diagram by hand.