
The 10 Best Scientific Figure Creation Tools in 2026: AI vs. Traditional Software
Linda
Compare the 10 best scientific figure creation tools in 2026, including Noah AI, BioRender, FigureLabs, GraphPad Prism, ChemDraw, and more.
Introduction: Choosing the Right Scientific Figure Tool in 2026
Scientific figure creation is no longer a simple choice between AI and traditional design software.
Researchers can now choose from AI-assisted scientific figure tools, life science illustration platforms, vector editors, statistical graphing software, and chemistry-specific drawing tools.
The best choice depends on where your workflow starts.
Some researchers need to turn biomedical literature, research questions, or uploaded files into a structured scientific figure. Others already know what they want to communicate and need precise visual editing, scientific assets, or publication-ready graphing tools.
This guide compares 10 scientific figure creation tools in 2026 and explains which workflow each tool is best suited for.
1. Noah AI
Best For: Medical and life science researchers who need to turn literature-backed research questions into structured biomedical figures.
Noah AI is designed for research-first scientific figure creation. Unlike tools that only start from a blank canvas, an icon library, or a template gallery, Noah AI can begin with a biomedical topic, uploaded files, or a research question. In Agent Mode, users can first search medical literature, review evidence, organize key findings, and build a structured analysis before moving into figure generation.
This makes Noah AI especially useful when the hardest part is not simply drawing, but deciding what the figure should communicate. For example, researchers can use Noah to investigate a disease mechanism, summarize PubMed evidence, compare clinical trial results, or analyze a drug target, and then turn that research logic into a multi-panel scientific figure.
Noah AI also supports a more flexible figure-generation workflow. Users can revise the output through follow-up instructions, adjust the figure structure, refine labels, change emphasis, or ask for a different visual direction. They can also upload reference images or visual examples and ask Noah AI to generate a new scientific figure in a similar style, helping the output better match a paper, presentation, poster, or team-specific visual standard.
For new users, Noah AI offers free usage credits, making it easier to try the full research-to-figure workflow before committing to a larger project. This lowers the barrier for researchers who want to test how Noah AI moves from literature search and evidence synthesis to structured biomedical figure generation.Why it shines:
- Literature-to-Figure Workflow: Noah AI can help users move from medical literature search and evidence review to structured figure concepts.
- Biomedical Research Focus: It is built for medicine, life sciences, and biopharma workflows, rather than general-purpose design.
- Agent-Based Analysis First: Users can use Agent Mode to clarify questions, break down tasks, search professional sources, and generate a research report before creating visuals.
- Reference Image Support: Noah AI can use uploaded images or visual references to guide the style and structure of generated scientific figures.
- Structured Multi-Panel Output: It can help create figures with mechanisms, data logic, clinical interpretation, and captions in one coherent visual structure.
Considerations: Noah AI is strongest when the figure is based on biomedical research context. Final outputs should still be reviewed by domain experts and may need visual polishing before journal submission or external publication.
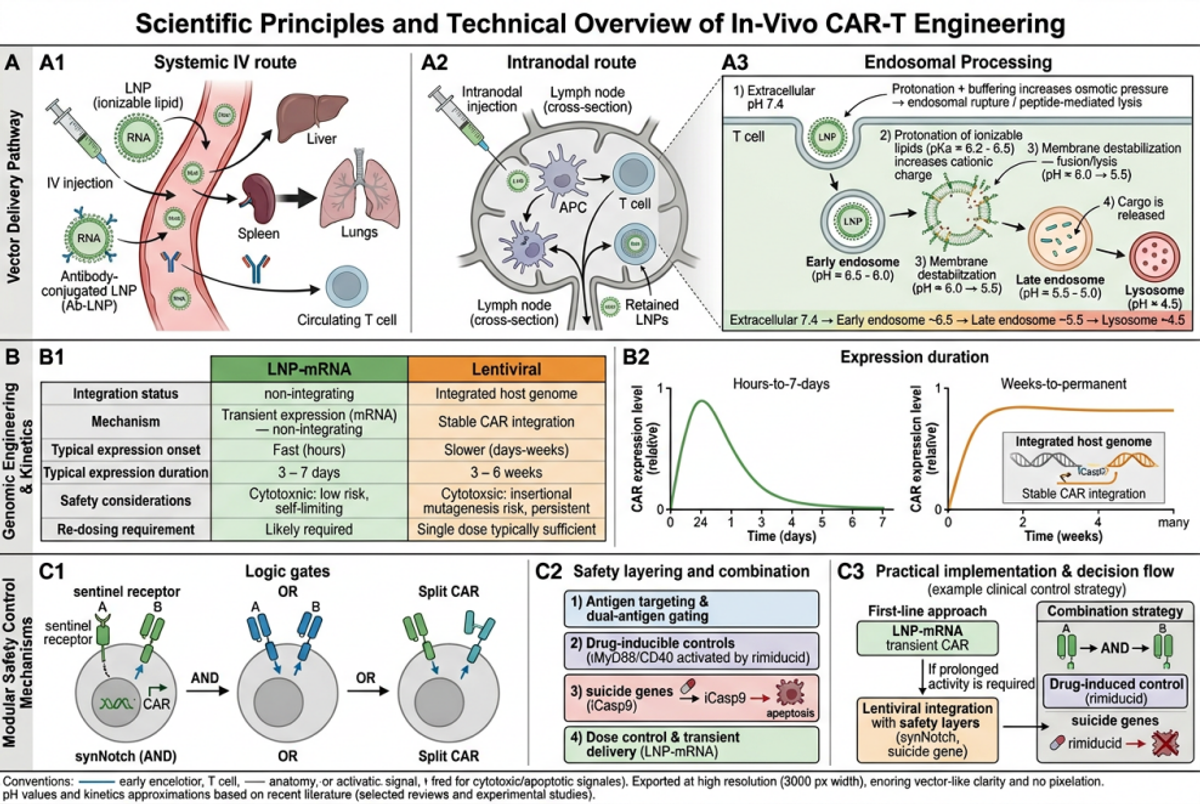
Considerations: Noah AI is not a traditional drag-and-drop design editor. It works best as a scientific figure planning and generation assistant before final manual review and polishing.
Free to use · Free credits included · No credit card required
Create a Scientific Figure with Noah AI →
2. BioRender
Best For: Researchers who need polished life science illustrations and biological diagrams.BioRender has become one of the most recognized tools for life science figures. It gives researchers access to scientific icons, templates, and pre-built visuals. Think of it as a visual toolkit for biology and medicine.Why it shines:
- Large Scientific Icon Library: Cells, organs, lab equipment, pathways, and disease models are easy to find.
- Professional Templates: Useful for graphical abstracts, posters, presentations, and publication figures.
- Team Collaboration: Helpful for labs that need consistent figure styles across projects.
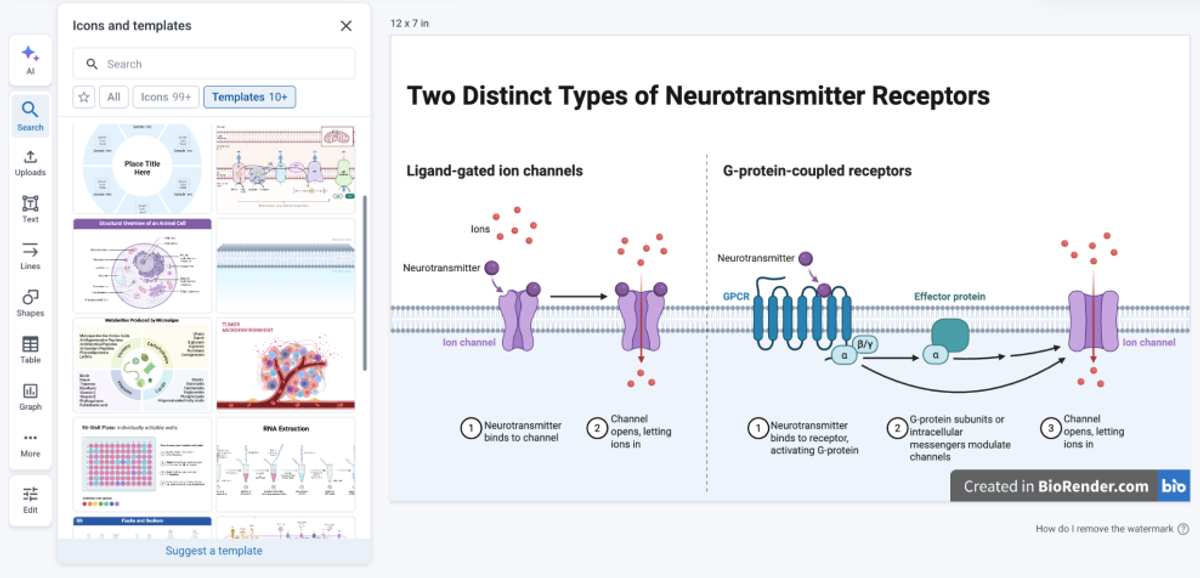
Considerations: BioRender is still largely a manual design tool. You need to know what you want to draw, then assemble the figure yourself using icons and templates.
3. FigureLabs
Best For: Researchers who want to generate scientific illustration drafts with AI.FigureLabs represents the AI-native side of scientific illustration. Instead of building every diagram manually, users can describe a scientific concept and generate a visual draft. It is useful for researchers who want to speed up ideation and avoid starting from an empty canvas.Why it shines:
- Text-to-Figure Workflow: Researchers can describe a scientific idea and receive a visual starting point.
- Fast Ideation: Useful for generating early drafts of mechanisms, pathways, or research visuals.
- Editable Output: AI-generated drafts can be refined and adjusted later.
Considerations: AI-generated visuals still require scientific review. FigureLabs is best used as a visual co-pilot, not a replacement for expert checking.
4. Mind the Graph
Best For: Graphical abstracts, research posters, and science infographics.Mind the Graph helps researchers create clear and visually appealing scientific graphics without advanced design skills. It is especially useful for graphical abstracts and educational visuals.Why it shines:
- Graphical Abstract Templates: Good for papers, posters, and conference presentations.
- Science-Focused Visual Style: The illustrations are designed for research communication rather than general marketing design.
- Easy to Use: Suitable for students and researchers who need fast visual outputs.
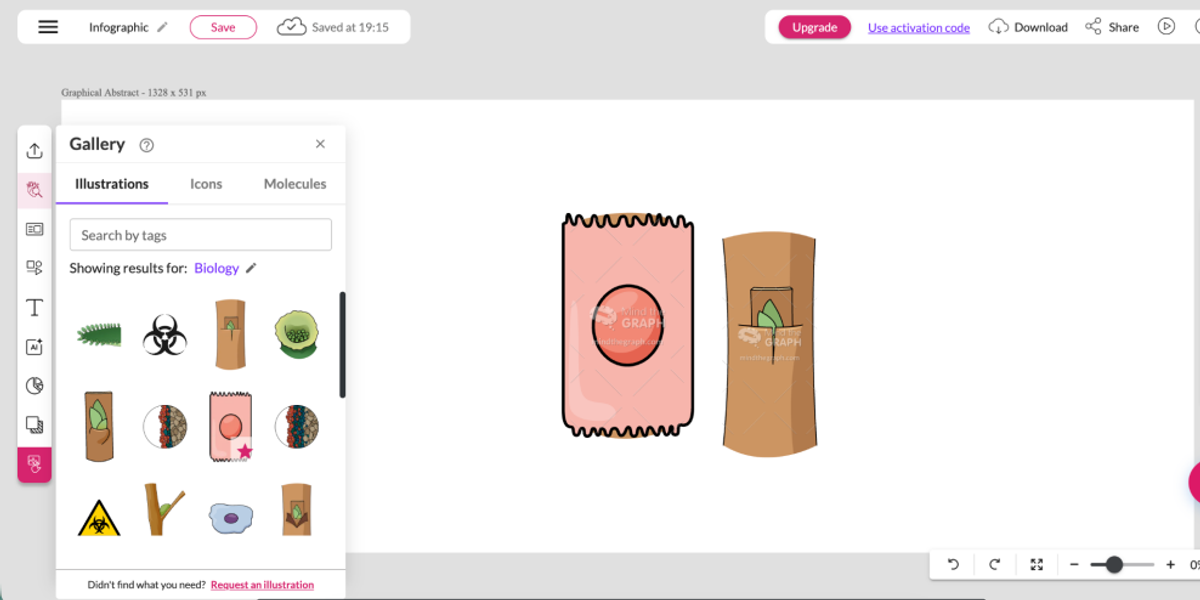
Considerations: It may be less flexible for highly customized or complex biomedical mechanisms.
5. PowerPoint
Best For: Quick sketches, lab meeting updates, and presentation figures.PowerPoint is often underestimated, but it remains one of the most accessible tools for scientific communication. Many researchers use it to sketch ideas, build workflow diagrams, and prepare slide-based visuals.Why it shines:
- Accessibility: Most researchers already know how to use it.
- Fast Mockups: Great for quickly testing figure layouts before moving to a professional tool.
- Presentation Workflow: It integrates naturally with talks, lectures, and lab meetings.
Considerations: PowerPoint is not built specifically for scientific illustration. Complex figures may look less polished without careful design work.
6. SciDraw
Best For: Researchers looking for free, community-sourced scientific drawings.SciDraw is a useful open resource for scientific illustrations. It provides community-shared drawings that researchers can reuse or adapt.Why it shines:
- Open Scientific Assets: Useful for finding free science-related drawings.
- SVG Flexibility: Many assets can be edited in tools like Illustrator or Inkscape.
- Community Value: Helpful for researchers who want reusable visuals without starting from scratch.
Considerations: It is not a complete figure creation platform. You may need another tool for editing and final layout.
7. Inkscape
Best For: Researchers who need professional vector editing without subscription cost.Inkscape is a free, open-source alternative to Adobe Illustrator. It supports SVG editing and can be used for publication-style figures.Why it shines:
- Cost-Effective: It is completely free and open source.
- Vector Editing: Useful for modifying diagrams, labels, and exported SVG files.
- Flexible Workflow: It can work alongside AI tools, BioRender exports, or SciDraw assets.
Considerations: Like Illustrator, it requires manual design work and does not provide built-in scientific reasoning.
8. Illustrae
Best For: Students and researchers who want quick AI-assisted scientific visuals.Illustrae is an AI scientific illustration tool for creating research visuals, educational materials, and presentation graphics.Why it shines:
- Fast Visual Drafts: Useful when you need a quick starting point.
- Accessible Interface: Designed for users without professional design experience.
- Research and Education Use Cases: Suitable for slides, teaching materials, and early figure drafts.
Considerations: As with any AI visual tool, outputs should be reviewed carefully for scientific accuracy.
9. GraphPad Prism
Best For: Scientific graphs, statistical plots, and data figures.GraphPad Prism is not a general scientific illustration tool, but it is essential for many research figures. It is widely used for statistical analysis and publication-quality data visualization.Why it shines:
- Strong Data Visualization: Good for bar charts, scatter plots, survival curves, and dose-response curves.
- Built-in Statistics: Helps researchers analyze and visualize data in one workflow.
- Publication-Ready Graphs: Commonly used in biomedical and life science research.
Considerations: Prism is best for data figures, not biological mechanisms or graphical abstracts.
10. ChemDraw
Best For: Chemical structures, reaction schemes, and medicinal chemistry figures.ChemDraw is the standard tool for chemistry-focused scientific communication. If your research involves molecules, compounds, or reaction mechanisms, ChemDraw is often necessary.Why it shines:
- Chemical Accuracy: It understands chemical structures, bonds, stereochemistry, and reaction notation.
- Professional Chemistry Output: Useful for papers, patents, presentations, and drug discovery workflows.
- Industry Standard: Widely recognized in chemistry and medicinal chemistry.
Considerations: ChemDraw is highly specialized. It is not designed for general biomedical diagrams or graphical abstracts.
Summary: Which Tool Should You Choose in 2026?
Scientific figure creation is no longer a one-tool workflow. Your choice depends on your priority: planning, speed, polish, control, or specialization.
- Use Noah AI if you need to turn biomedical research context into a structured scientific figure.
- Use BioRender if you need polished life science diagrams and graphical abstracts.
- Use FigureLabs if you want fast AI-generated scientific illustration drafts.
- Use Mind the Graph if you need graphical abstracts, posters, and science infographics.
- Use PowerPoint if you need quick sketches and presentation-ready drafts.
- Use SciDraw if you want free community-sourced scientific assets.
- Use Inkscape if you need free vector editing.
- Use Illustrae if you want quick AI-assisted scientific visuals.
- Use GraphPad Prism if you need statistical graphs and data figures.
- Use ChemDraw if you need chemical structures and reaction schemes.
Summary: Which Scientific Figure Tool Should You Choose in 2026?
The best scientific figure tool depends on the type of work you need to complete.
Use Noah AI when you want to move from biomedical research context, literature, uploaded files, or a research question into a structured scientific figure.
Use BioRender when scientific illustration, science-specific visual assets, and detailed figure editing are the main priorities.
Use FigureLabs when you want to explore an AI-assisted figure-generation workflow.
Use Mind the Graph for graphical abstracts, posters, and science-focused visual communication.
Use PowerPoint for fast diagrams, lab-meeting figures, and presentation workflows.
Use SciDraw when you need reusable scientific illustration assets.
Use Inkscape when you need free, precise vector editing.
Use Illustrae when you want to explore AI-assisted scientific visual drafting.
Use GraphPad Prism for statistical analysis and quantitative research figures.
Use ChemDraw for chemical structures, reaction schemes, and medicinal chemistry figures.
The Verdict
Scientific figure creation in 2026 is increasingly a multi-tool workflow.
The important question is not simply whether a tool uses AI. It is where the tool fits in the research process.
For biomedical researchers, Noah AI is particularly relevant when figure creation begins with scientific context rather than an already finished visual concept. Researchers can move from a biomedical question or evidence workflow toward a structured figure and then iteratively refine the output.
Other tools remain useful for different stages: BioRender for science-focused visual editing, GraphPad Prism for quantitative figures, ChemDraw for chemistry, and Inkscape for vector-level refinement.
Create Scientific Figures with Noah AI
Turn biomedical research questions, literature context, uploaded files, and reference images into structured scientific figure drafts with Noah AI.
Free to use · Free credits included · No credit card required
Create a Scientific Figure with Noah AI →