Best AI Tools for Cross-Trial Evidence Comparison (2026)
Linda
Compare the best AI tools for cross-trial evidence comparison. We test Noah AI on first-line PD-1/PD-L1 NSCLC trials (KEYNOTE-024, KEYNOTE-042, IMpower110, EMPOWER-Lung 1).
Cross-trial evidence comparison looks simple until two studies that appear to answer the same clinical question turn out to use different eligibility criteria, biomarker definitions, endpoint hierarchies, follow-up windows, crossover rules, or analysis populations.
That is the real research task. The goal is not to place several overall-survival numbers in one table and declare a winner. A useful cross-trial workflow first aligns the studies, shows where they differ, and separates descriptive comparison from conclusions that would require a formal indirect treatment comparison, meta-analysis, or network meta-analysis.
For this guide, we tested Noah AI on a real oncology case: first-line PD-1/PD-L1 monotherapy versus platinum-based chemotherapy in advanced non-small cell lung cancer (NSCLC), using KEYNOTE-024, KEYNOTE-042, IMpower110, and EMPOWER-Lung 1 as the main trials.
Quick answer: Noah AI is a strong fit when the task is biomedical and the researcher wants a cited, structured comparison that keeps trial-population and design differences visible. Elicit is better aligned with formal systematic-review screening and extraction. Consensus is useful for broad multi-step literature exploration. Scite is especially useful for citation-context checking. SciSpace is useful for paper discovery and PDF-centered literature review workflows.
Why Cross-Trial Comparison Is Harder Than a Results Table
Two phase 3 trials can study the same disease class and still be poor candidates for direct numerical comparison. Before interpreting efficacy, researchers usually need to answer a more basic set of questions:
| Comparison question | Why it matters |
|---|---|
| Were the same patients eligible? | Differences in stage, prior treatment, performance status, molecular exclusions, and baseline prognosis can change observed outcomes. |
| Was the biomarker defined the same way? | A shared label such as “PD-L1 high” does not guarantee the same assay, scoring system, biological compartment, or threshold. |
| Were endpoints and analyses aligned? | Primary versus secondary endpoints, hierarchical testing, censoring rules, and analysis populations affect interpretation. |
| Was follow-up equally mature? | Early and long-term survival estimates should not be treated as if they were measured at the same evidence maturity. |
| Did crossover or later therapy differ? | Post-progression treatment can change the overall-survival effect observed in the randomized comparison. |
Which AI Tool Fits Which Part of the Workflow?
The tools below are useful for different parts of cross-trial evidence work. This is a workflow-fit comparison, not a claim that one platform is universally superior.
| Tool | Best fit | Useful for cross-trial work | Important limitation |
|---|---|---|---|
| Noah AI | Biomedical research questions that need structured, cited synthesis | Organizing trial design, population, biomarker, endpoint, follow-up, evidence maturity, and interpretation caveats in one research workflow | Does not turn separate trials into a randomized head-to-head comparison or replace statistical evidence synthesis |
| Elicit | Systematic reviews and structured paper extraction | Search, screening, data extraction, source-supported tables, and evidence synthesis across many papers | Clinical comparability still depends on the review question, extraction design, and methodological judgment supplied by the researcher |
| Consensus | Rapid exploration of peer-reviewed research | Multi-step literature search, filters, cited answers, and longer Deep Search reviews across selected papers | Primarily literature-centered rather than a dedicated clinical-trial benchmarking workflow |
| Scite | Citation-context checking and research verification | Seeing whether later papers support, contrast with, or mention a cited study; useful when checking how evidence has been received | Not designed as a complete trial-alignment or comparative-effectiveness pipeline |
| SciSpace | Literature discovery and PDF-centered review | Finding papers, filtering results, reading documents, and organizing literature-review evidence | Best treated as a paper-review workspace rather than a substitute for formal cross-trial statistical comparison |
A Real Biomedical Case: High-PD-L1 First-Line NSCLC
The case is useful because the trials look superficially similar: all evaluate first-line checkpoint-inhibitor monotherapy against platinum-based chemotherapy in advanced NSCLC. But the study populations and biomarker frameworks are not identical.
| Trial | Key population feature | Design point relevant to comparison |
|---|---|---|
| KEYNOTE-024 | Previously untreated metastatic NSCLC with PD-L1 TPS ≥50% and no sensitizing EGFR or ALK alteration | Randomized phase 3 trial; chemotherapy patients could cross over to pembrolizumab after progression. Five-year follow-up has been published. |
| KEYNOTE-042 | Previously untreated locally advanced or metastatic NSCLC with PD-L1 TPS ≥1% | Overall survival was tested sequentially in TPS ≥50%, ≥20%, and ≥1% populations, so the overall enrolled population should not be treated as equivalent to a ≥50%-selected trial. |
| IMpower110 | PD-L1-selected metastatic NSCLC; the high-expression analysis used TC ≥50% or IC ≥10% by SP142 in EGFR/ALK-wild-type disease | The PD-L1 scoring framework includes both tumor-cell and immune-cell criteria, which is not the same construct as TPS alone. |
| EMPOWER-Lung 1 | Advanced NSCLC with PD-L1 expression in ≥50% of tumor cells and no EGFR, ALK, or ROS1 aberration in the five-year report | Five-year outcomes are available, but the trial population and biomarker definition still need to be aligned before comparing numerical outcomes with other studies. |
The point of this case is not to rank pembrolizumab, atezolizumab, and cemiplimab. It is to test whether an AI research workflow can preserve the differences that determine whether a cross-trial statement is reasonable.
Running the Case in Noah's New Agent Interface
Noah's current interface places the research setup inside the Agent workspace. For this test, we opened Agent from the left navigation, selected Medical & Academia, chose Deep Research, and used 5.6 Terra · Balanced for the run.
The prompt explicitly instructed Noah not to rank therapies from unadjusted trial results. Instead, it asked the agent to compare trial design, population, PD-L1 definition, endpoints, follow-up, outcomes, crossover or subsequent-treatment considerations, and the major reasons direct comparison may be invalid.
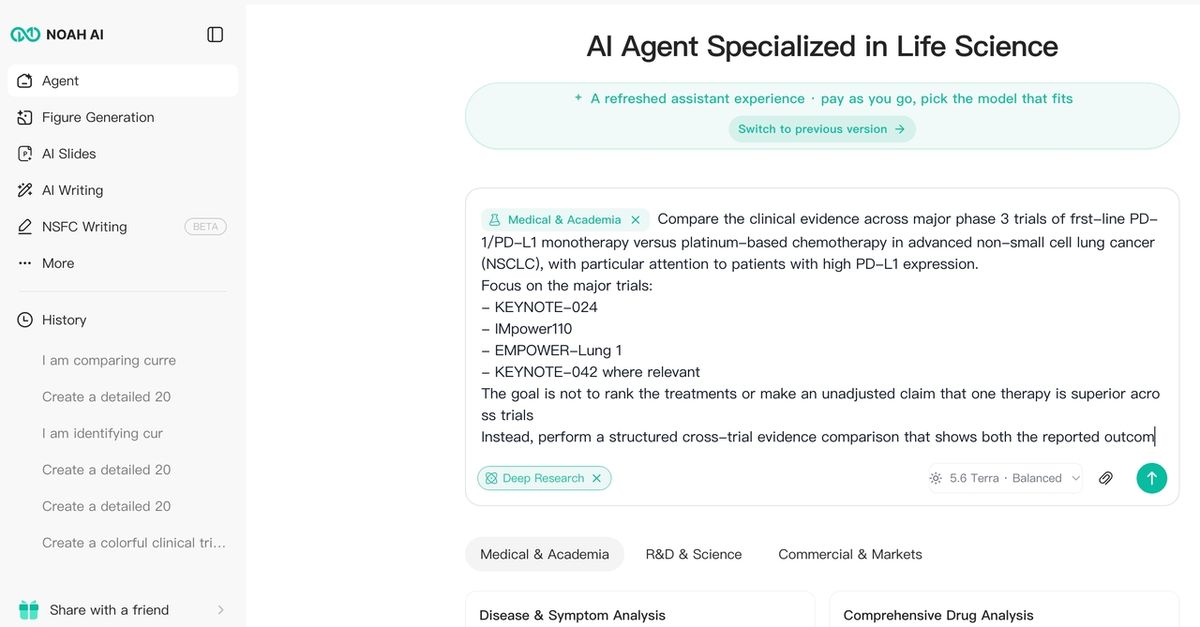
Figure 1. Noah AI's new Agent interface configured for a Deep Research cross-trial evidence comparison in advanced NSCLC.
Why the prompt matters
A vague instruction such as “compare these immunotherapy trials” encourages a model to summarize the studies or rank visible outcome numbers. A better prompt defines the comparison dimensions before retrieval begins and explicitly separates:
- within-trial randomized treatment effects;
- descriptive differences across separate trials; and
- claims that require a formal indirect comparison.
The Most Useful Output Was Not an Efficacy Ranking
The strongest part of this Noah run was a section titled “Population-alignment issues critical to cross-trial comparison.” Instead of presenting the trials as interchangeable, the output highlighted where population definitions diverged.
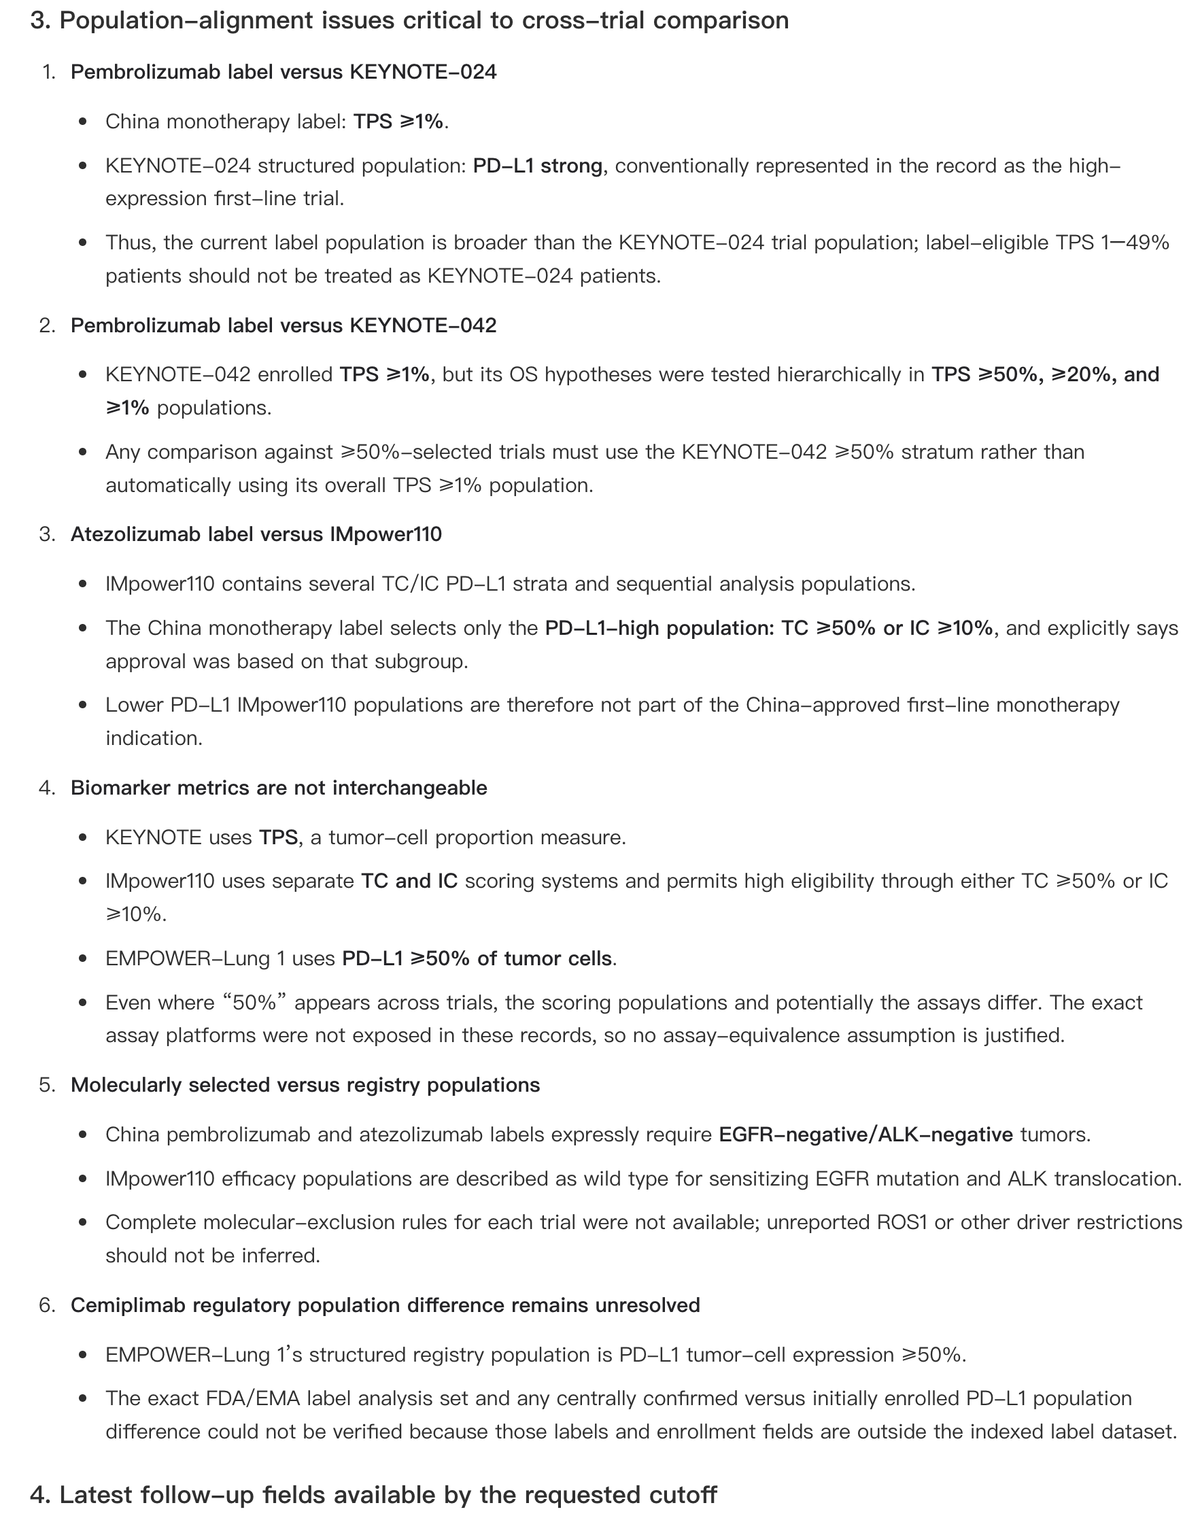
Figure 2. Noah AI flags population-alignment and biomarker-definition issues before any attempt to interpret cross-trial outcome differences.
Try Noah AI for Free
Use Noah AI to search, compare, and analyze biomedical evidence with AI-powered research workflows.
Free credits are available, and no credit card is required to get started.
What this result reveals
Three distinctions are especially important.
1. KEYNOTE-042 is not simply another ≥50% trial. It enrolled TPS ≥1% disease and tested overall survival hierarchically across nested TPS populations. A comparison with a ≥50%-selected trial should therefore use the relevant ≥50% stratum, not automatically the full KEYNOTE-042 population.
2. “PD-L1 high” is not one universal definition. KEYNOTE trials use tumor proportion score, while IMpower110 uses tumor-cell and immune-cell scoring criteria. EMPOWER-Lung 1 uses PD-L1 expression in at least 50% of tumor cells. Similar-looking thresholds do not make the selected populations identical.
3. Label populations and trial populations should not be conflated. The Noah run also compared trial populations with retrieved label populations, illustrating why current label eligibility can be broader or differently defined than the population enrolled in a pivotal study.
Important limitation of this specific run: Noah reported that its indexed authoritative label collection for this retrieval covered China/NMPA labels rather than FDA/EMA labels. The label-based observations in the screenshot should therefore be interpreted in that geographic context, not generalized to every regulator.
How to Read Cross-Trial Evidence Without Over-Interpreting It
A practical way to interpret a cross-trial table is to separate information into three levels.
| Level | What can be done | Example |
|---|---|---|
| Describe | Report what each individual trial studied and what it found within its randomized comparison | State each trial's eligibility, treatment arms, endpoints, and within-trial hazard ratio |
| Compare cautiously | Discuss visible differences in design, biomarker selection, follow-up, and evidence maturity | Explain why TPS ≥50% and TC/IC-defined high PD-L1 populations are not automatically equivalent |
| Do not rank directly | Avoid using separate-trial medians, response rates, or hazard ratios as if they came from one randomized experiment | Do not conclude that one checkpoint inhibitor is superior because its trial reported a numerically longer median OS |
This distinction matters because randomization protects the comparison within a trial. It does not randomize patients across KEYNOTE-024, IMpower110, EMPOWER-Lung 1, and KEYNOTE-042.
When a Structured Comparison Is Not Enough
AI can reduce the manual work of finding, aligning, and summarizing evidence, but some research questions require a formal statistical method rather than a descriptive cross-trial table.
If the goal is comparative effectiveness across treatments that were not tested head-to-head, researchers may need an anchored indirect treatment comparison, network meta-analysis, matching-adjusted indirect comparison, simulated treatment comparison, or another prespecified evidence-synthesis method. These methods rely on assumptions about comparability, treatment-effect modifiers, common comparators, and population overlap.
Treatment switching is another example. In oncology trials, crossover or later use of active immunotherapy can change what the observed overall-survival estimate represents. A simple statement such as “no protocol crossover” is not enough to establish that later therapy had no influence on survival interpretation.
What Researchers Still Need to Verify
Before using an AI-generated cross-trial comparison in medical affairs, clinical development, regulatory work, investment research, or treatment-related decision support, verify the following against the original sources:
- the exact analysis population used for every reported result;
- biomarker assay, scoring method, cutoff, and testing procedure;
- randomized enrollment and any biomarker-evaluable subset;
- primary and secondary endpoint definitions;
- data cutoff and actual median follow-up;
- crossover rules and subsequent anticancer therapy;
- hazard ratios, confidence intervals, multiplicity control, and statistical hierarchy;
- safety denominator, exposure duration, and adverse-event collection window;
- whether the source is a registry entry, peer-reviewed publication, conference abstract, label, HTA document, or secondary report.
In this Noah run, the retrieved structured records did not expose every field needed for a fully harmonized comparison, including exact randomized enrollment, all assay details, trial dosing, crossover rules, and mature numerical outcome tables. That is a reason to verify source documents, not a reason to fill the gaps by inference.
How the Tools Differ in Practice
Noah AI
Noah is most relevant when a life-science user starts with a biomedical question and wants to move toward a structured, cited research output that keeps trial context visible. The real value in this case was not a longer summary; it was the identification of alignment problems before outcome interpretation.
Elicit
Elicit is better aligned with systematic-review workflows. Its official systematic-review product covers search, screening, structured data extraction, and evidence synthesis. This makes it useful when the project needs reproducible paper selection and extraction across a larger review corpus.
Consensus
Consensus is useful when the first challenge is broad scientific literature exploration. Its current Pro and Deep modes can plan multi-step searches, apply filters, review multiple papers, and return citation-backed answers. It is a strong discovery and literature-synthesis option, but cross-trial clinical interpretation still requires explicit attention to trial design and comparability.
Scite
Scite is particularly useful after key papers have been identified. Smart Citations show whether later citation statements support, contrast with, or mention a paper, which helps researchers inspect the context around influential findings instead of relying on citation counts alone.
SciSpace
SciSpace is useful for literature discovery and paper-centered review. Its literature-review workflow supports topic search, paper filtering, and document analysis, making it helpful when the work begins with a set of papers rather than a clinical-trial benchmarking question.
FAQ
Can AI compare results from different clinical trials?
Yes, AI can help retrieve, structure, align, and summarize trial evidence. It can also flag important differences in population, biomarker definitions, endpoints, and follow-up. It should not convert separate randomized trials into a head-to-head efficacy comparison without an appropriate statistical method.
Can hazard ratios be ranked across separate trials?
Not reliably on their numerical size alone. Hazard ratios come from different randomized experiments with different populations, comparators, follow-up, analysis methods, and treatment contexts. A smaller hazard ratio in one trial does not by itself prove that the treatment is superior to a therapy tested elsewhere.
Is cross-trial evidence comparison the same as meta-analysis?
No. A structured cross-trial comparison is usually descriptive. Meta-analysis and network meta-analysis are statistical evidence-synthesis methods with explicit assumptions, model choices, and uncertainty estimates.
What should be standardized before comparing clinical trials?
At minimum: disease setting, stage, line of therapy, eligibility criteria, molecular exclusions, biomarker definition, intervention, comparator, endpoint, analysis population, follow-up, crossover, subsequent therapy, and evidence maturity.
Why can two “PD-L1 high” trials still be difficult to compare?
Because “high” may refer to different assays, scoring systems, biological compartments, or thresholds. A percentage alone does not establish that two trials selected the same patient population.
Which AI tool is best for cross-trial evidence comparison?
It depends on the workflow. Noah is a strong fit for biomedical question-to-synthesis work; Elicit is well suited to systematic-review extraction; Consensus is useful for broad literature exploration; Scite adds citation-context intelligence; and SciSpace is useful for literature and PDF review. Formal comparative-effectiveness questions may still require specialist statistical methods outside these AI workflows.
Final Takeaway
The useful outcome of cross-trial evidence comparison is not a leaderboard. It is a structured view of what each trial actually studied, which evidence can reasonably be viewed side by side, and where differences in population, biomarker selection, endpoint design, follow-up, or subsequent treatment make a direct comparison unsafe.
In the NSCLC case above, Noah's most useful output was the population-alignment analysis. It showed why apparently similar high-PD-L1 trials should not be treated as interchangeable before the underlying trial definitions are checked.
Related Research Guides
- Best AI Tools for Clinical Trial Results Analysis (2026)
- How to Analyze Clinical Trial Results with AI Using Noah AI
- Best AI Tools for Turning Research Questions into Evidence Tables (2026)
- Best AI Tools for Medical Literature Search and Research Writing (2026)
- Best Elicit Alternatives for Biomedical Literature Review (2026)